Interactive Wi-Fi optimization tool using simulated annealing, supporting 800% zoom and binary coverage matrices up to 2000x2000 pixel scale.
Overview
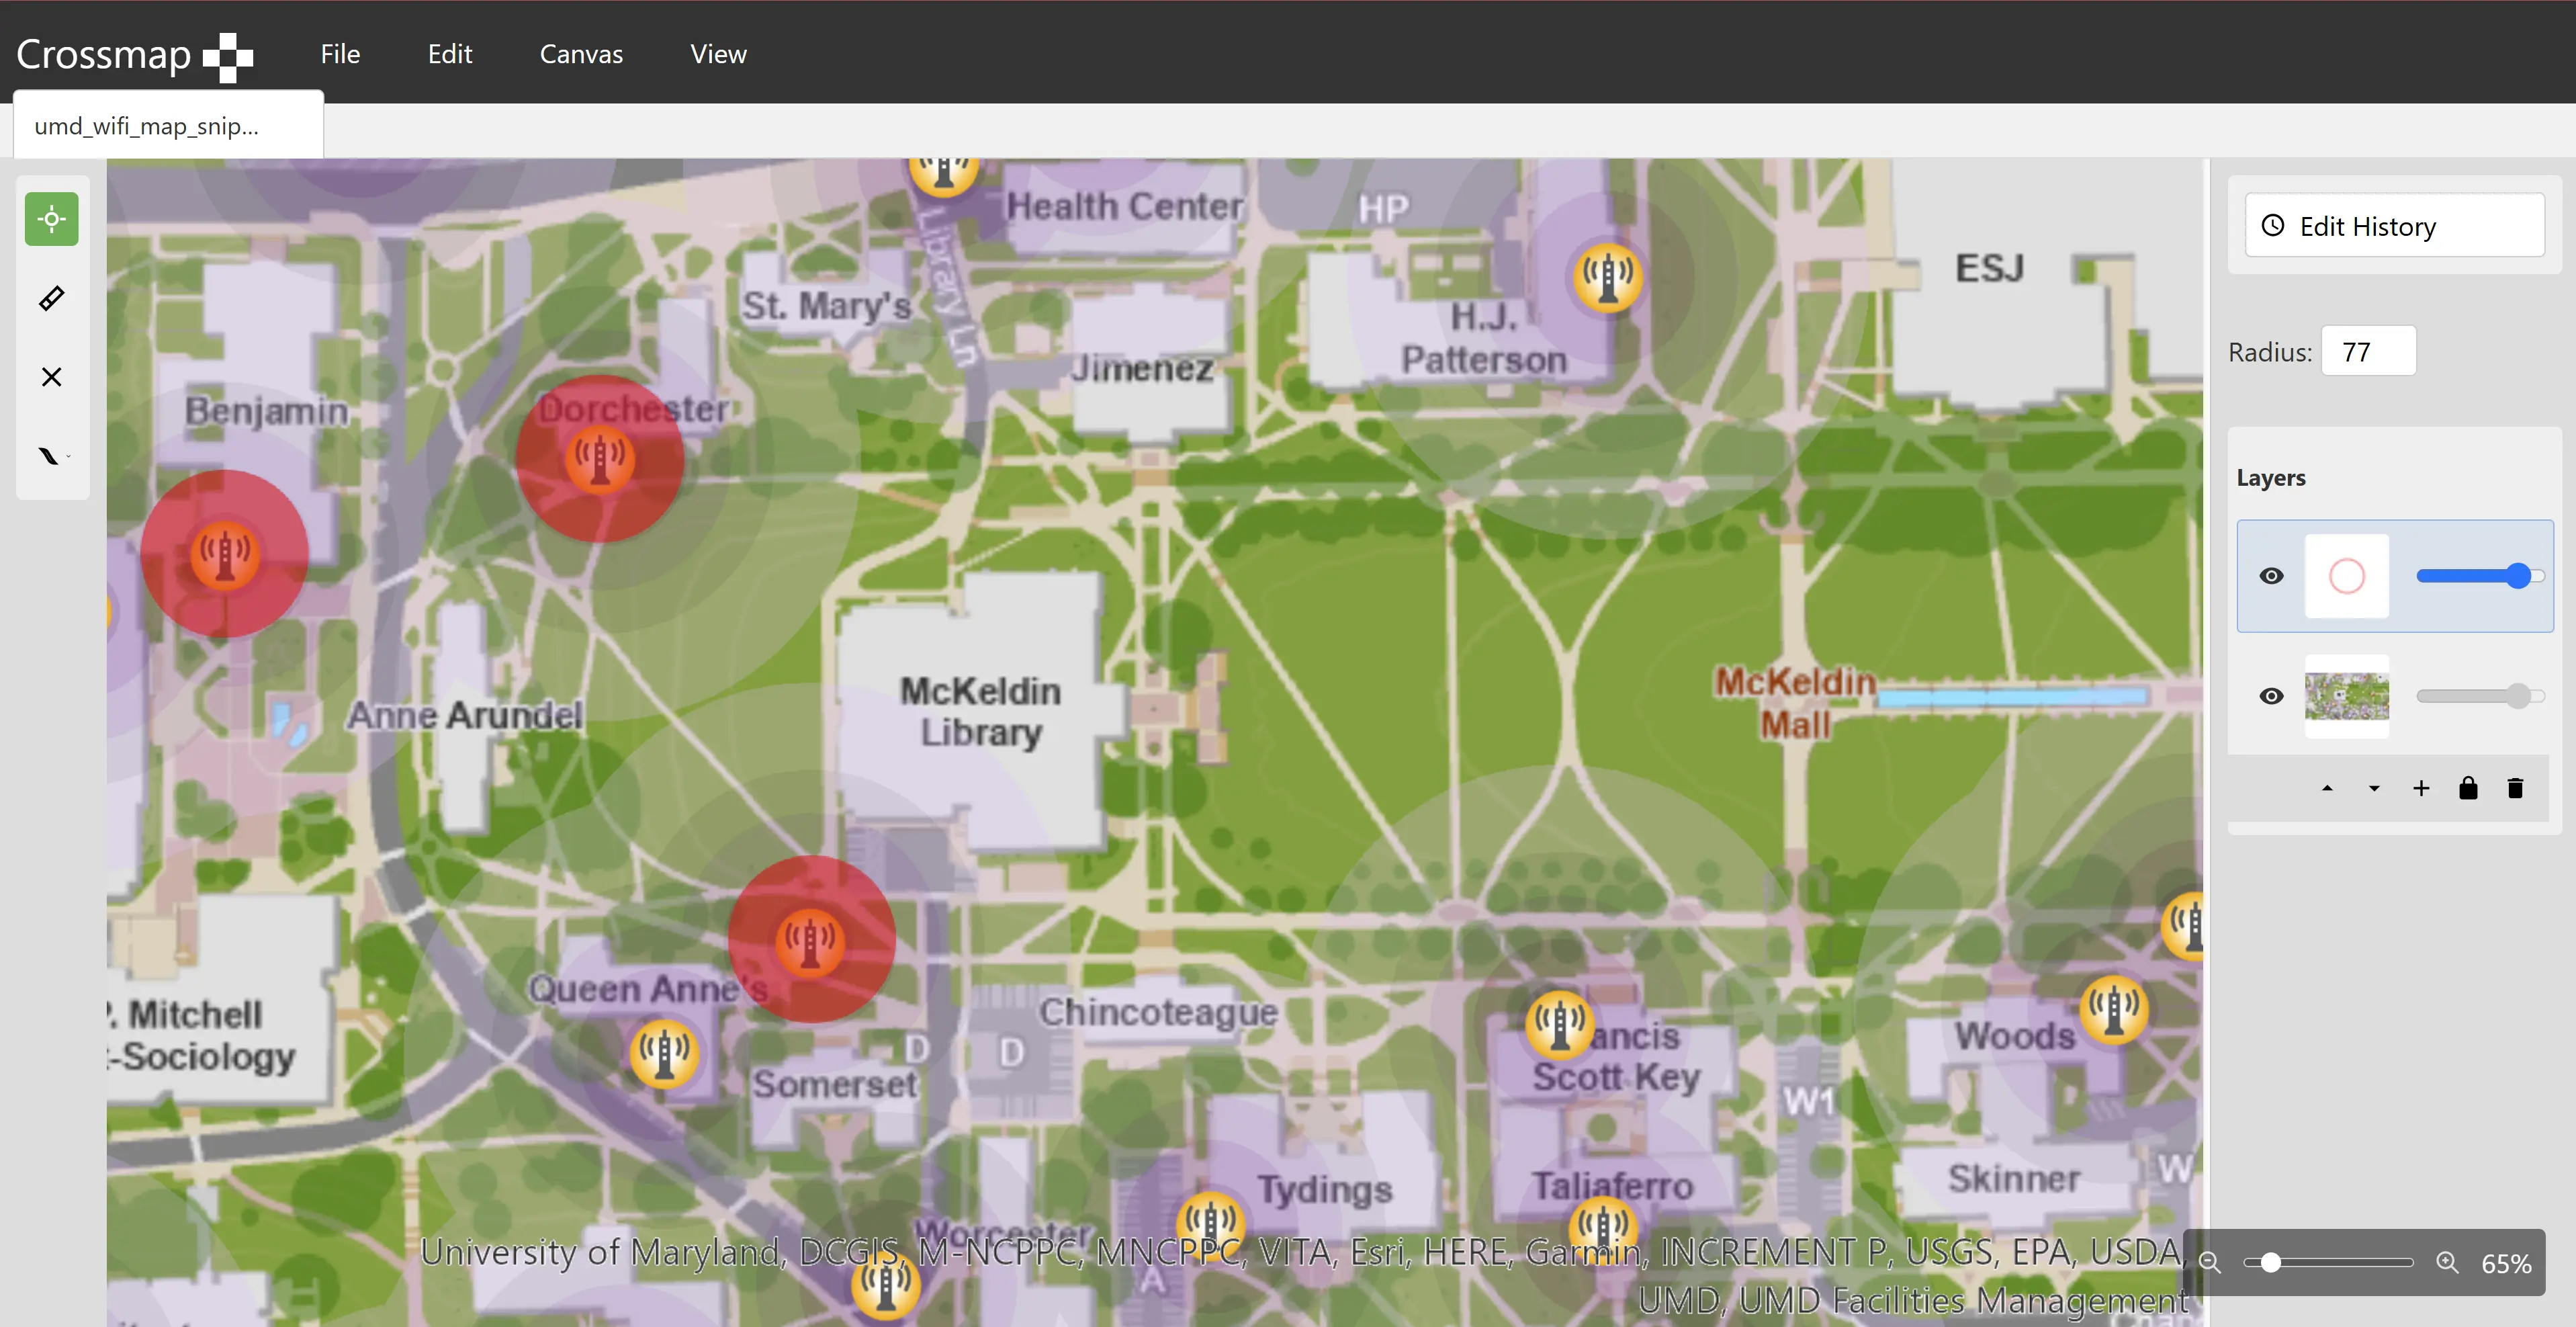
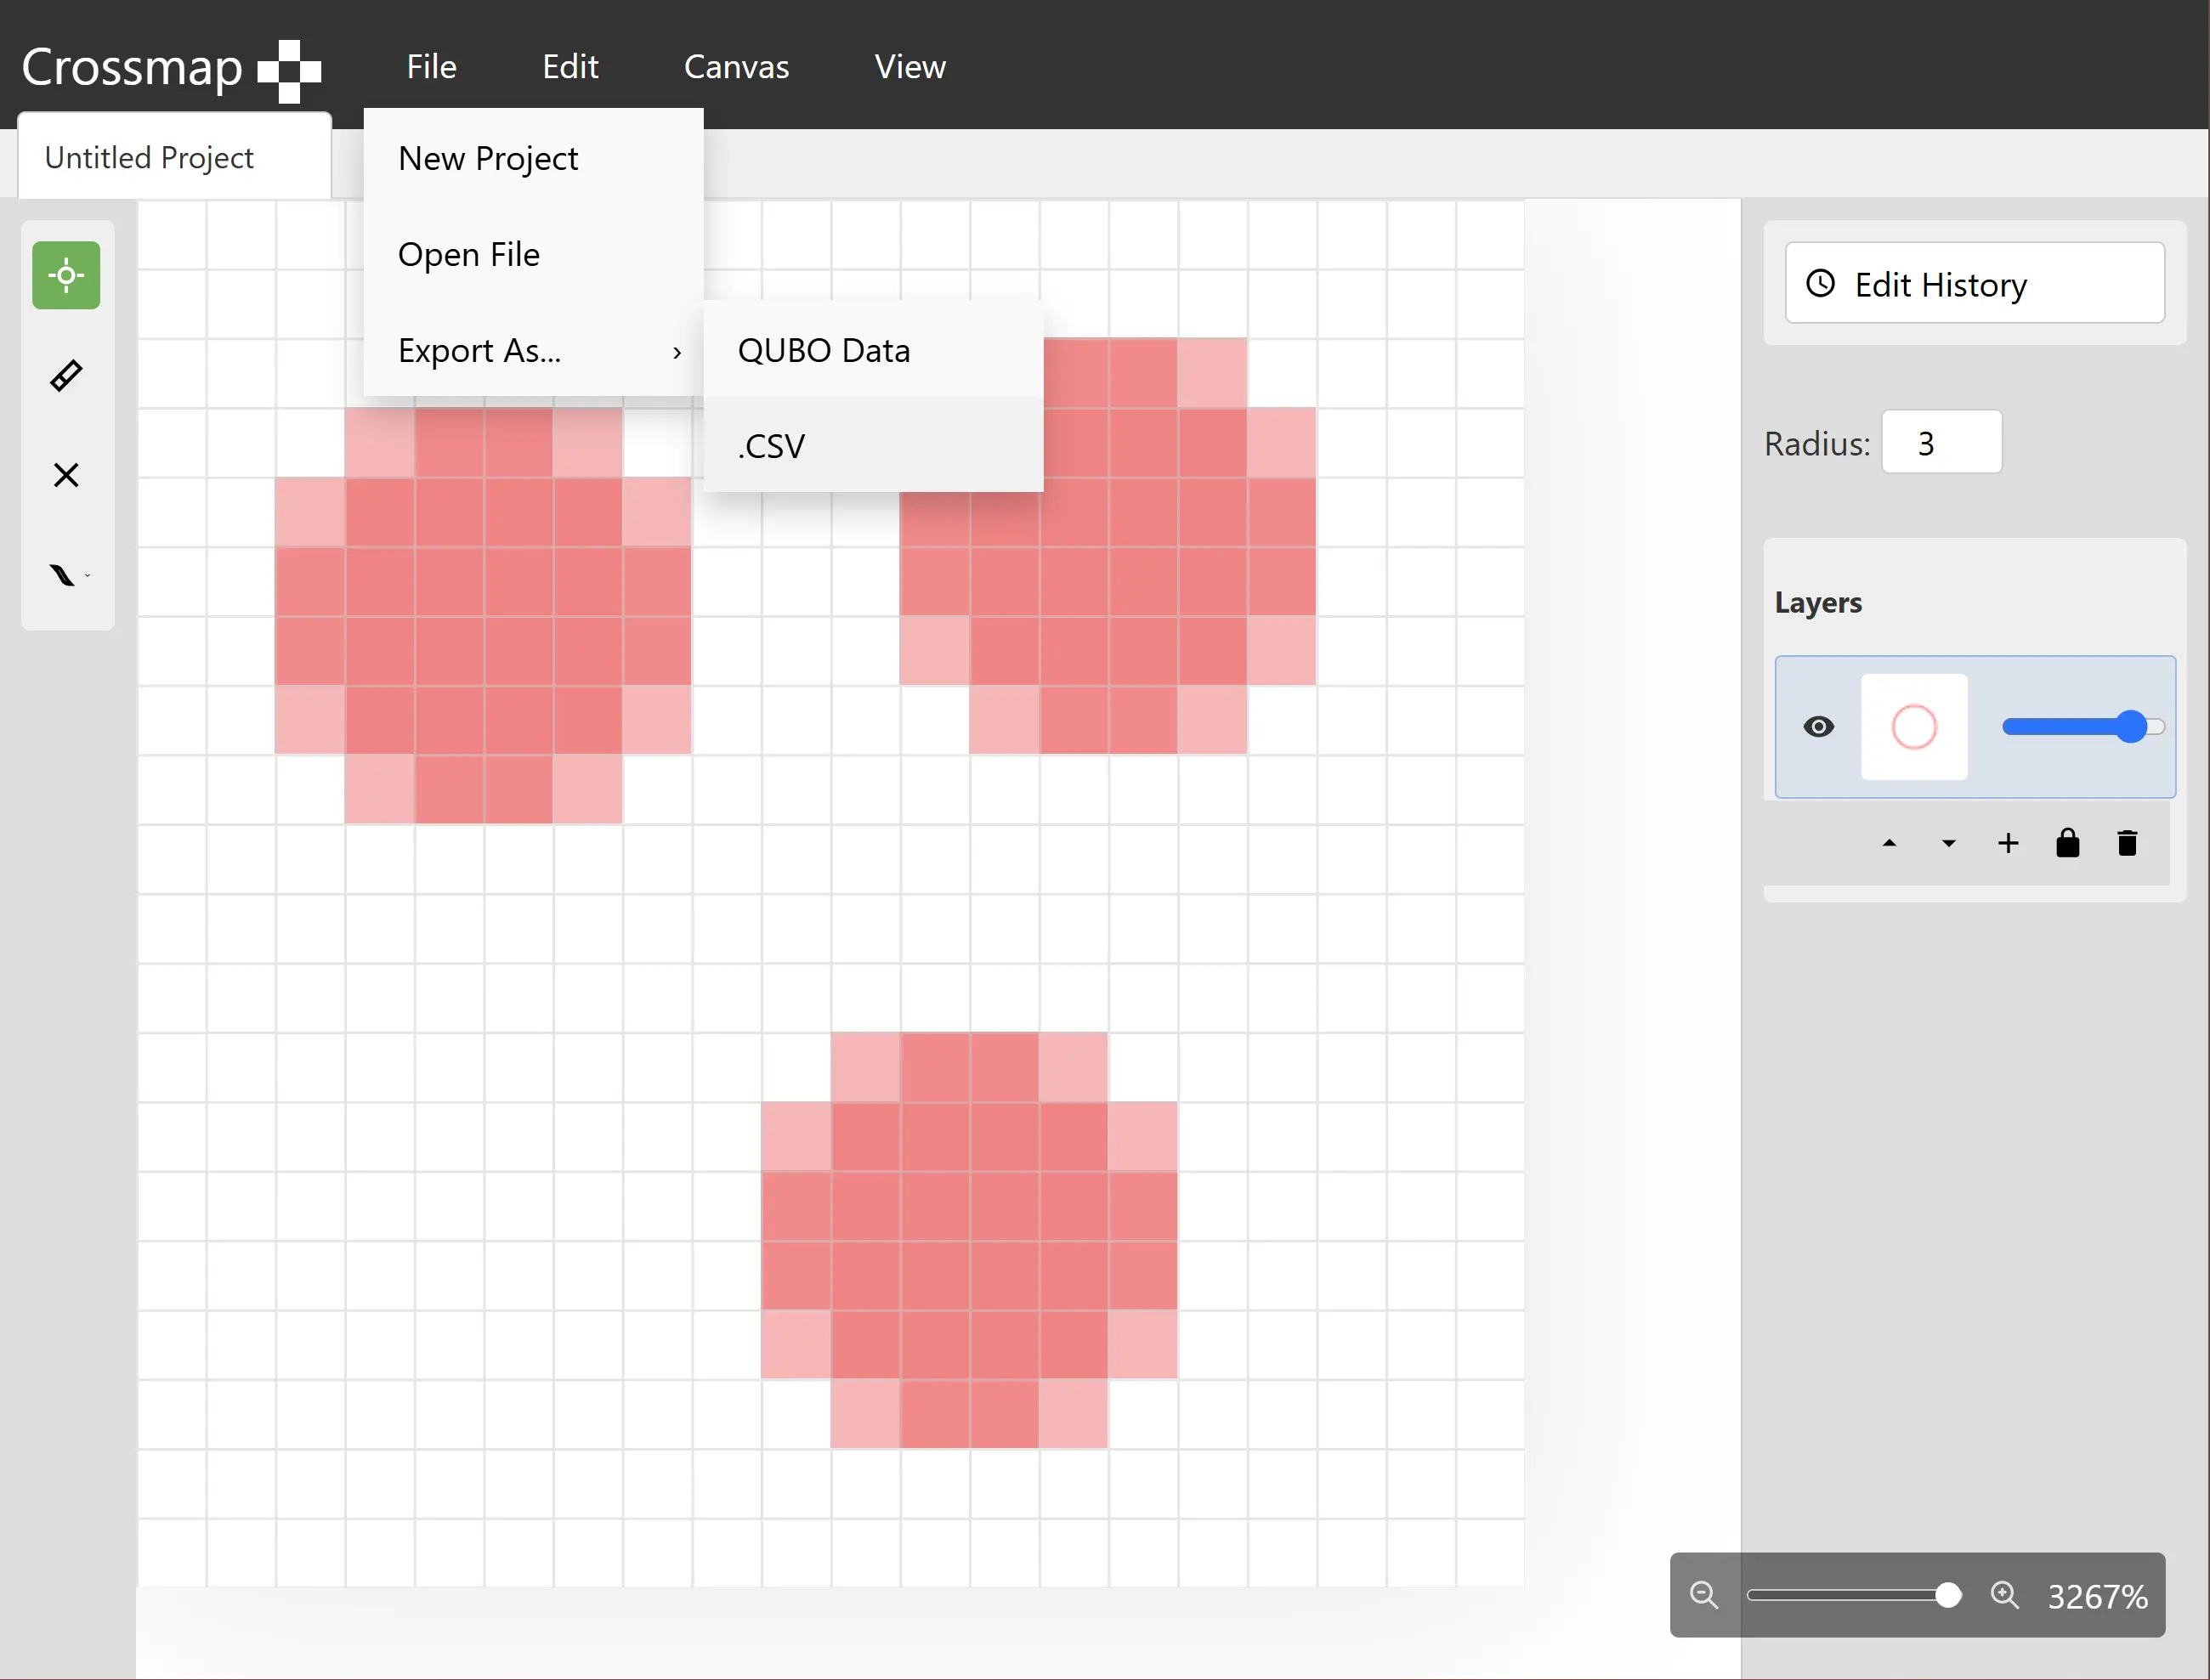
I built this as a side project to help our UMD FIRE research team visually generate test data for simulated annealing and quantum Wi-Fi optimization algorithms. Instead of hand-coding coordinate arrays, I put together a React and Canvas interface modeled after Photoshop's tools so anyone in our group could click directly on high-resolution campus maps, drop coverage nodes, adjust radii, and immediately export binary matrices.
You can view the full implementation in the repository here.
Highlights
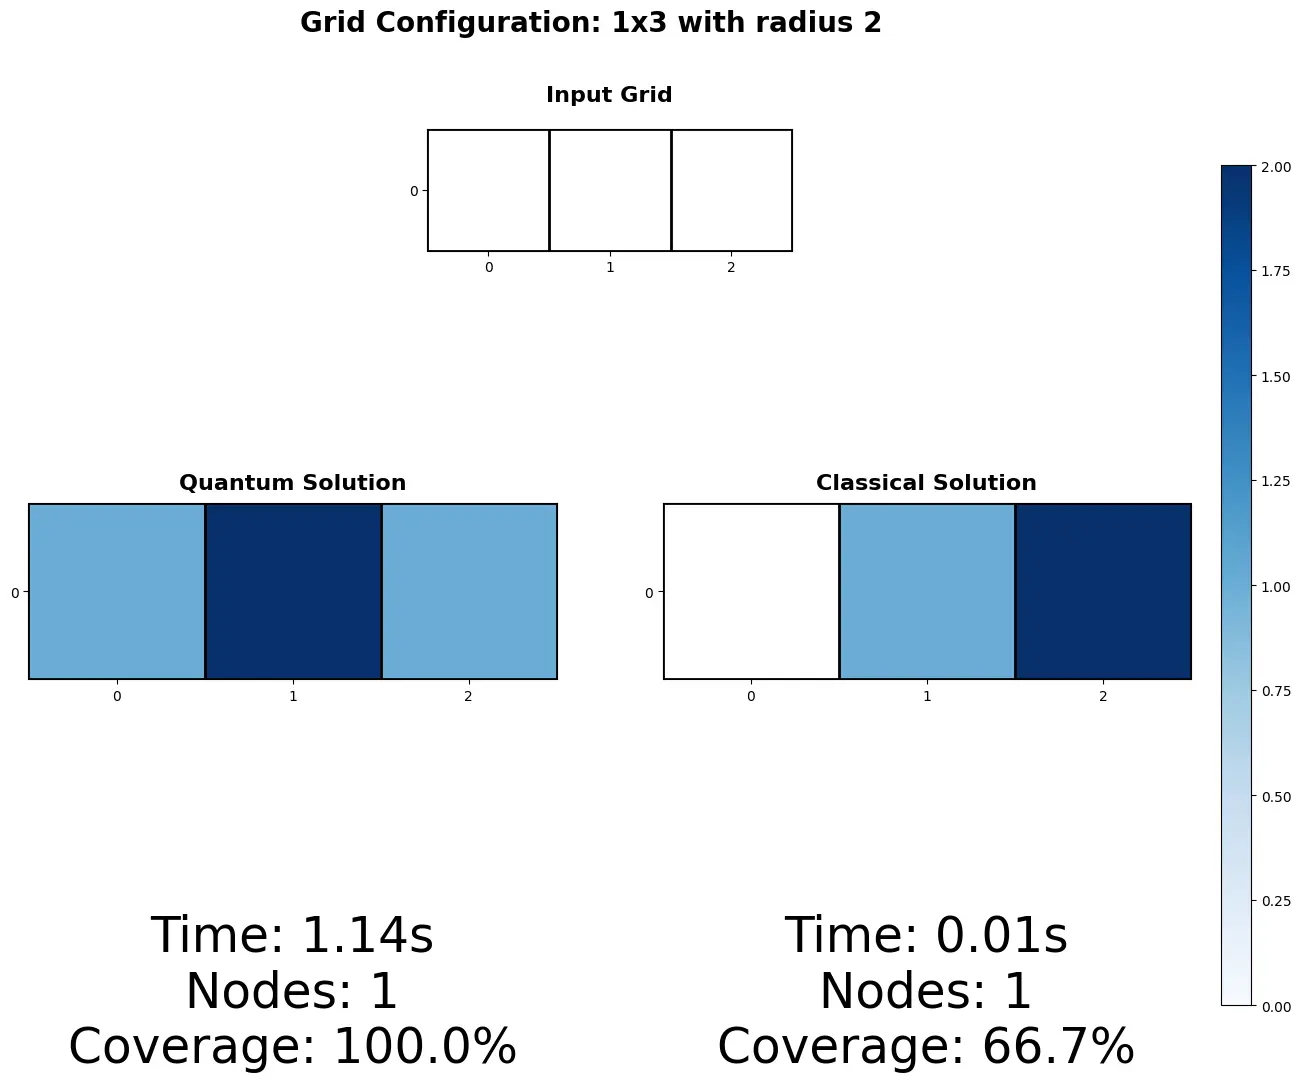
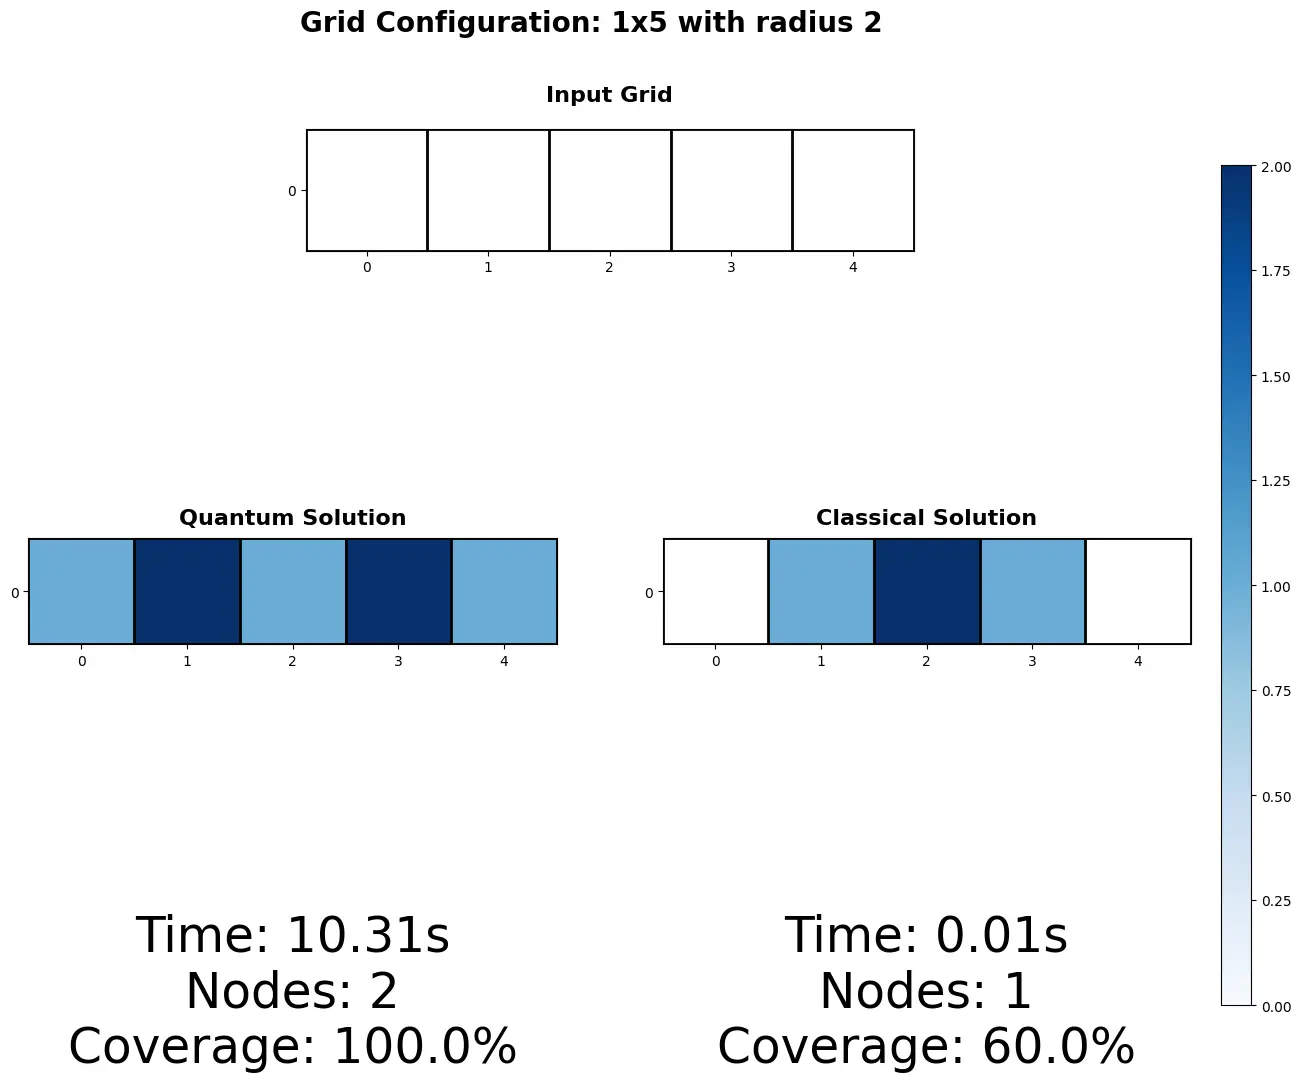
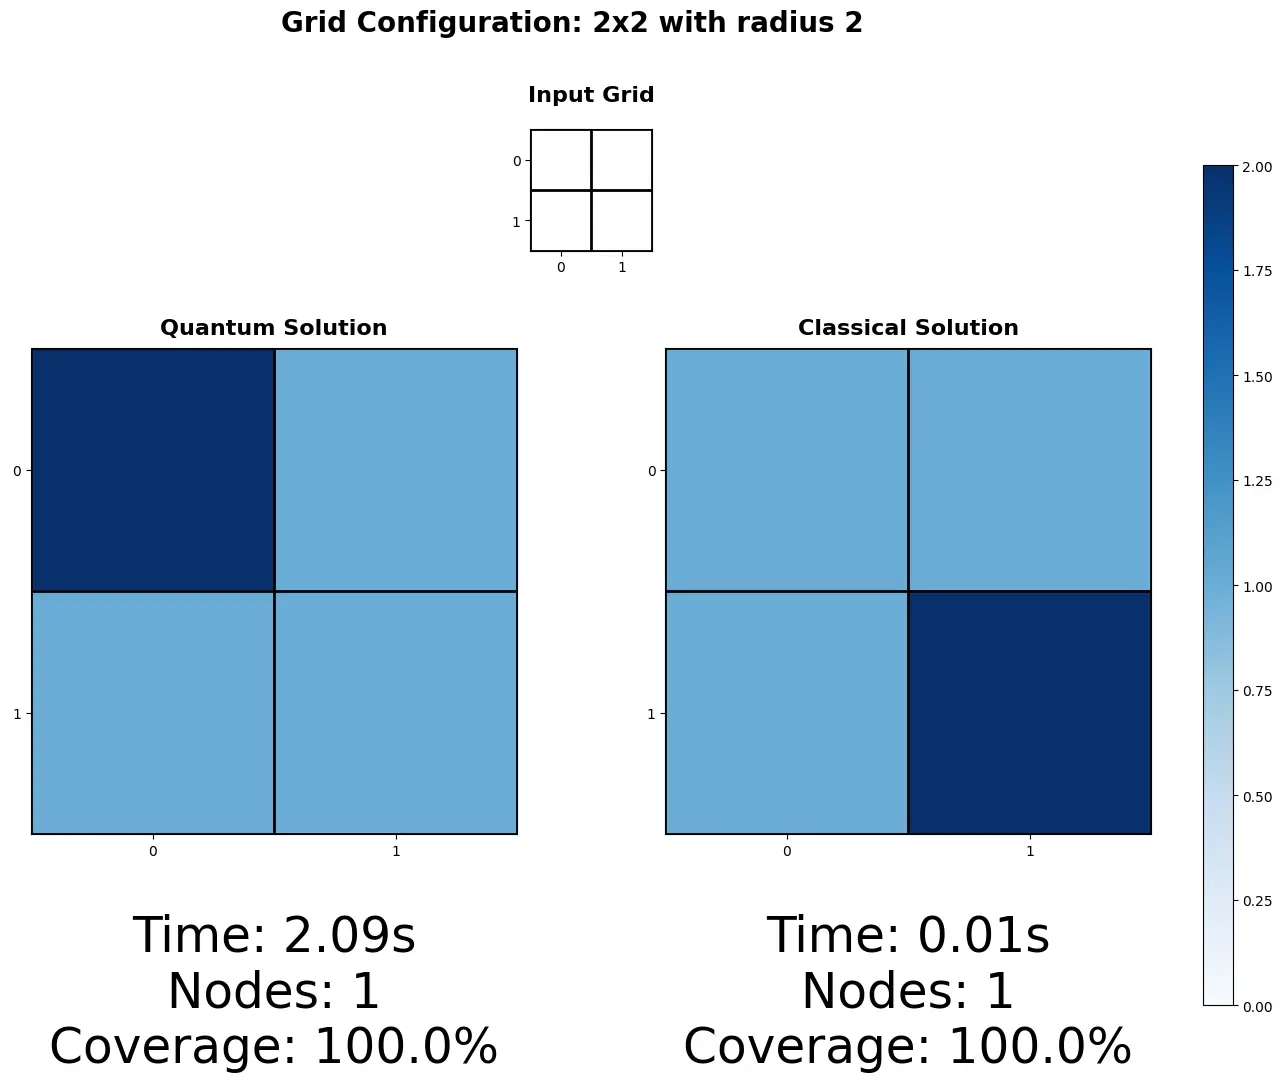
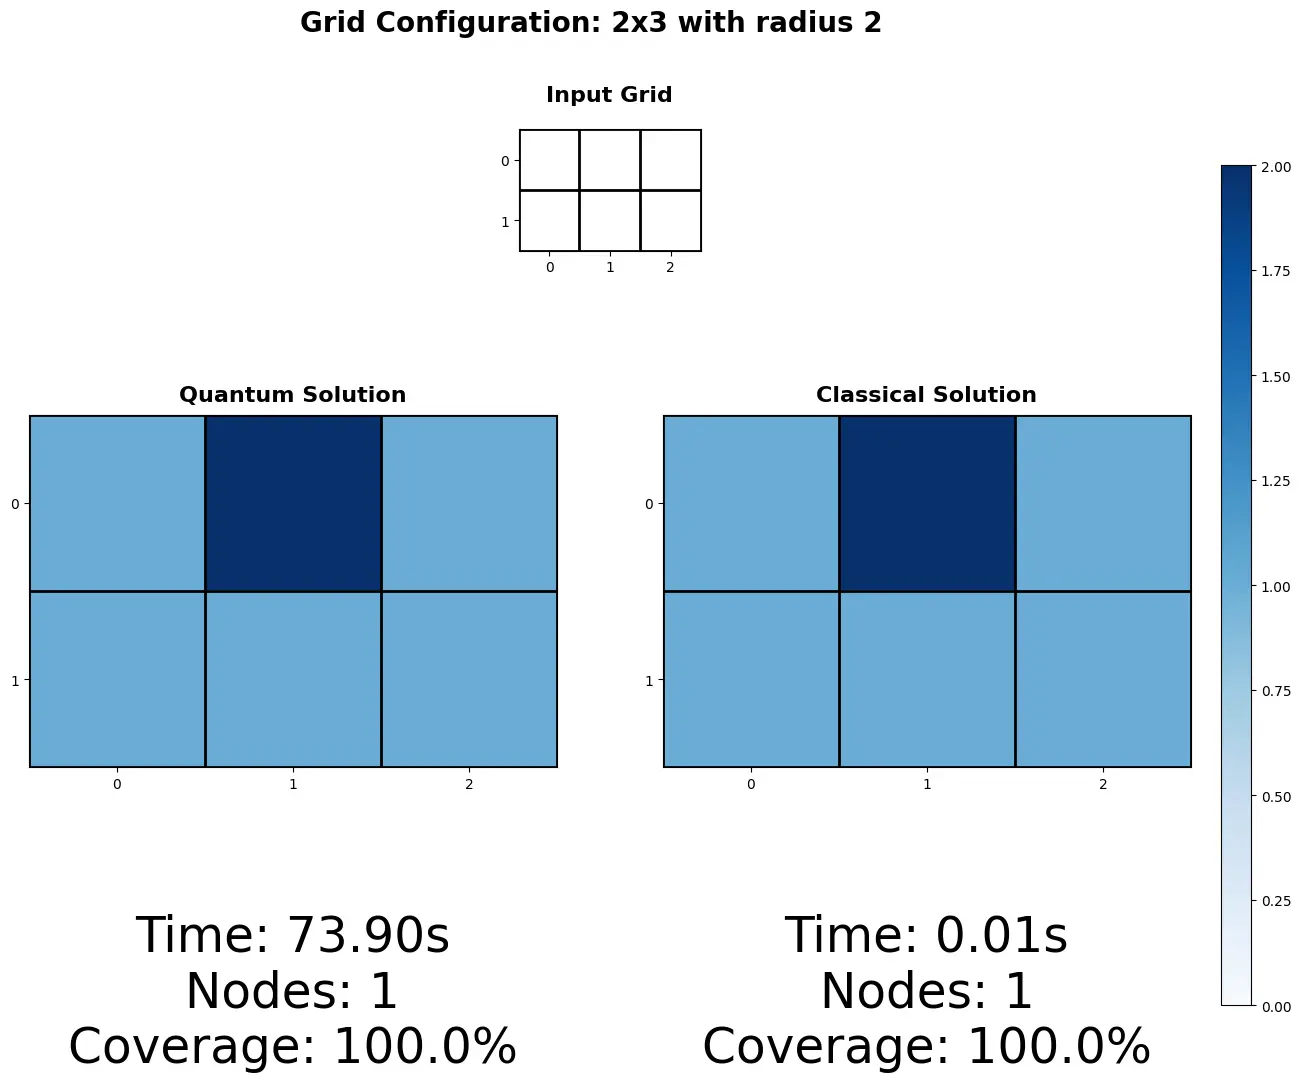
Built a Wi-Fi coverage solver, testing the math on small 3x3 grids first before testing on full campus map resolutions.
Created an interactive React canvas for placing and dragging nodes, live radius adjustments, and one-click CSV matrix export.
Added up to 800% zoom with pan controls to accurately place nodes across high-res campus map images up to 2000x2000.
Research Context
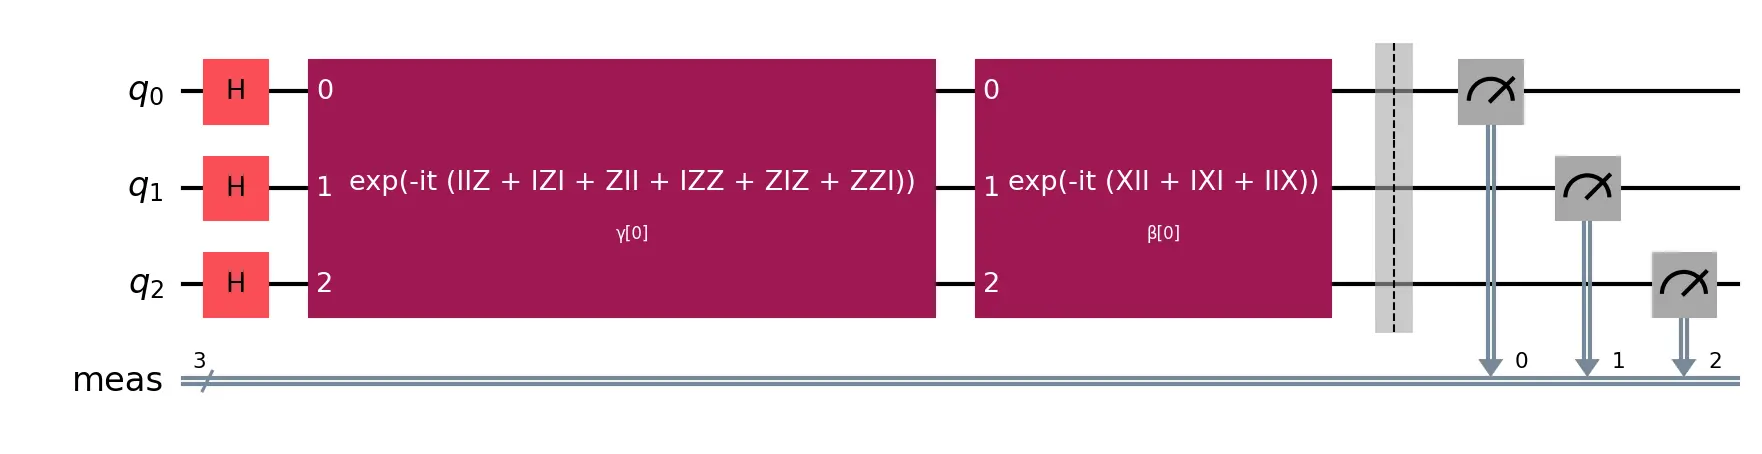
Our team used these map layouts as benchmark problems to compare classical simulated annealing against quantum algorithms like QAOA on simulated hardware. Testing classical baselines on these campus grid setups helped us measure where quantum optimization approaches hold potential as quantum hardware scales up.